System Architecture
Overview of the global layered architecture:
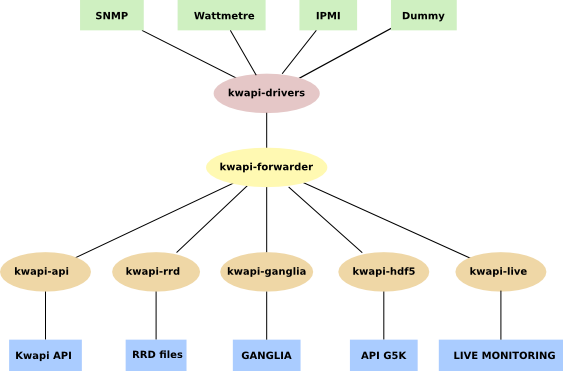
Kwapi drivers
Kwapi drivers are derived from a Driver superclass, itself derived from Thread. So drivers are threads. At least one driver thread is instantiated for each wattmeter or switch you want to monitor. Their constructors takes as arguments a list of probe IDs, and kwargs (specific arguments).
Driver threads roles are:
- Setting up a wattmeter or a switch.
- Listening and decoding received data.
- Calling a driver superclass method with measurements as argument. This method appends signature to the measurements, and publishes them on the bus.
Message format:

There is several types of drivers already implemented in Kwapi. You can of course implement your own driver.
SNMP drivers
Using the SNMP protocol and the right OIDs, you can retrieve a subtree of values corresponding, for a wattmeter, at the power consumption, for a switch, at the network traffic of ihis interfaces.
Of course, this driver works with any device that implement SNMP protocol. So you can retrieve other metrics depending on what you want to monitor.
Wattmeters via SNMP
Kwapi supports different kinds of wattmeters (IPMI, Eaton PDU, Wattsup, etc). Wattmeters communicate via IP networks or serial links. Each wattmeter has one or more sensors (probes). Wattmeters send their values quite often (each second), and they are listen by wattmeter drivers.
Network drivers
Second type of drivers is the network drivers. Giving a switch address and the correct protocol, you can retrieve incoming and outgoing traffic. You have just to configure the right OIDs and allow SNMP requests on the switch. Every port of the given switch is scanned and the current counter value of the interface is assigned to the configured neighbor. This counter is a 64-bits number that correspond to the total number of octets received on the interface, including framing characters.
Dummy drivers
Added as a testing feature, dummy drivers just send the value you ask them to send. They are used to simulate a probe. You can configure them as you wish. Kwapi implements dummynet and dummywatt drivers to simulate network and wattmeter drivers.
IPMI drivers
IPMI drivers use the command line ipmitool to retrieve information from IPMI sensors.
JSON url drivers
This driver can be used to get informations directly from JSON structured text of Grid‘5000 API. It can be usefull when you want to import in Kwapi remote metrics from the Metrologie API.
Driver manager
The driver manager is the loader and the checker of driver threads. It loads all drivers according the configuration file, and checks regularly that driver threads are alive. In case of crash, the event is logged and the driver thread is reloaded. We can imagine that a driver will crash if a technician unplug a wattmeter, for example.
Bus
Currently, the internal Kwapi bus is ZeroMQ. Publishers are driver threads, and subscribers are plugins.
Kwapi plugins
Kwapi API plugin
Kwapi API offers a REST API. This API is linked in Grid‘5000 API and adopts its standard to expose live measures to the users. Such data can then be imported in experiments by just sending a request to the API. This plugin contains a collector that computes kWh for power, interface counters for network and an API based on Flask.
Collector
The collector stores these values for each probe:

- Fields:
- Probe id: could be the hostname of the monitored machine. But it is a bit more complicated because a probe can monitor several machines (PDU).
- Timestamp: is updated when a new value is received.
- Integrated (power only): is computed by taking into account the new value in watt, and the elapsed time since the previous update.
- Value: offers the possibility to know instantaneous consumption or traffic of a device, without having to query two times a probe in a small interval to deduce it. This could be especially useful if a probe has a large refresh interval: there is no need to wait its next value.
- Unit: metric unit. For example ‘W’ stands for watt in power API.
- Type: metric type can be ‘Gauge’ or ‘Cumulative’. It indicates if measures are retrivied as counter or not and if an integrated value can be calculated
No history is kept by this plugin. Storage is offered with other plugins. The collector is cleaned periodically to prevent a deleted probe from being stored indefinitely in the collector. So when a probe has not been updated for a long time, it is deleted.
API
| Verb | URL | Parameters | Expected result |
|---|---|---|---|
| GET | /probe-ids/ | Returns all known probe IDs. | |
| GET | /probes/ | Returns all information about all known probes. | |
| GET | /probes/<probe>/ | probe id | Returns all information about this probe (id, timestamp, value, type, integrated). |
| GET | /probes/<probe>/<metric>/ | probe id metric {power, network} | Returns the probe’s metric value. |
Kwapi RRD plugin
It stores information from the drivers directly in RRD files. The advantage of such files is that they permits to render efficiently Graphs with various scales. The size of the databases are constant. One database per probe and per metric is created. By default, RRD files are stored in /var/lib/kwapi/kwapi-rrd.
This plugin create and update automatically the RRD files, depending on the values he receives from the drivers.
- As each plugin, he needs:
- Probe id: probe identifier (could be different than probe name)
- Name: metric name
- Timestamp: time of the measure, given by the driver, unix format timestamp
- Measure: measure
- Parameters: other informations about the metrics
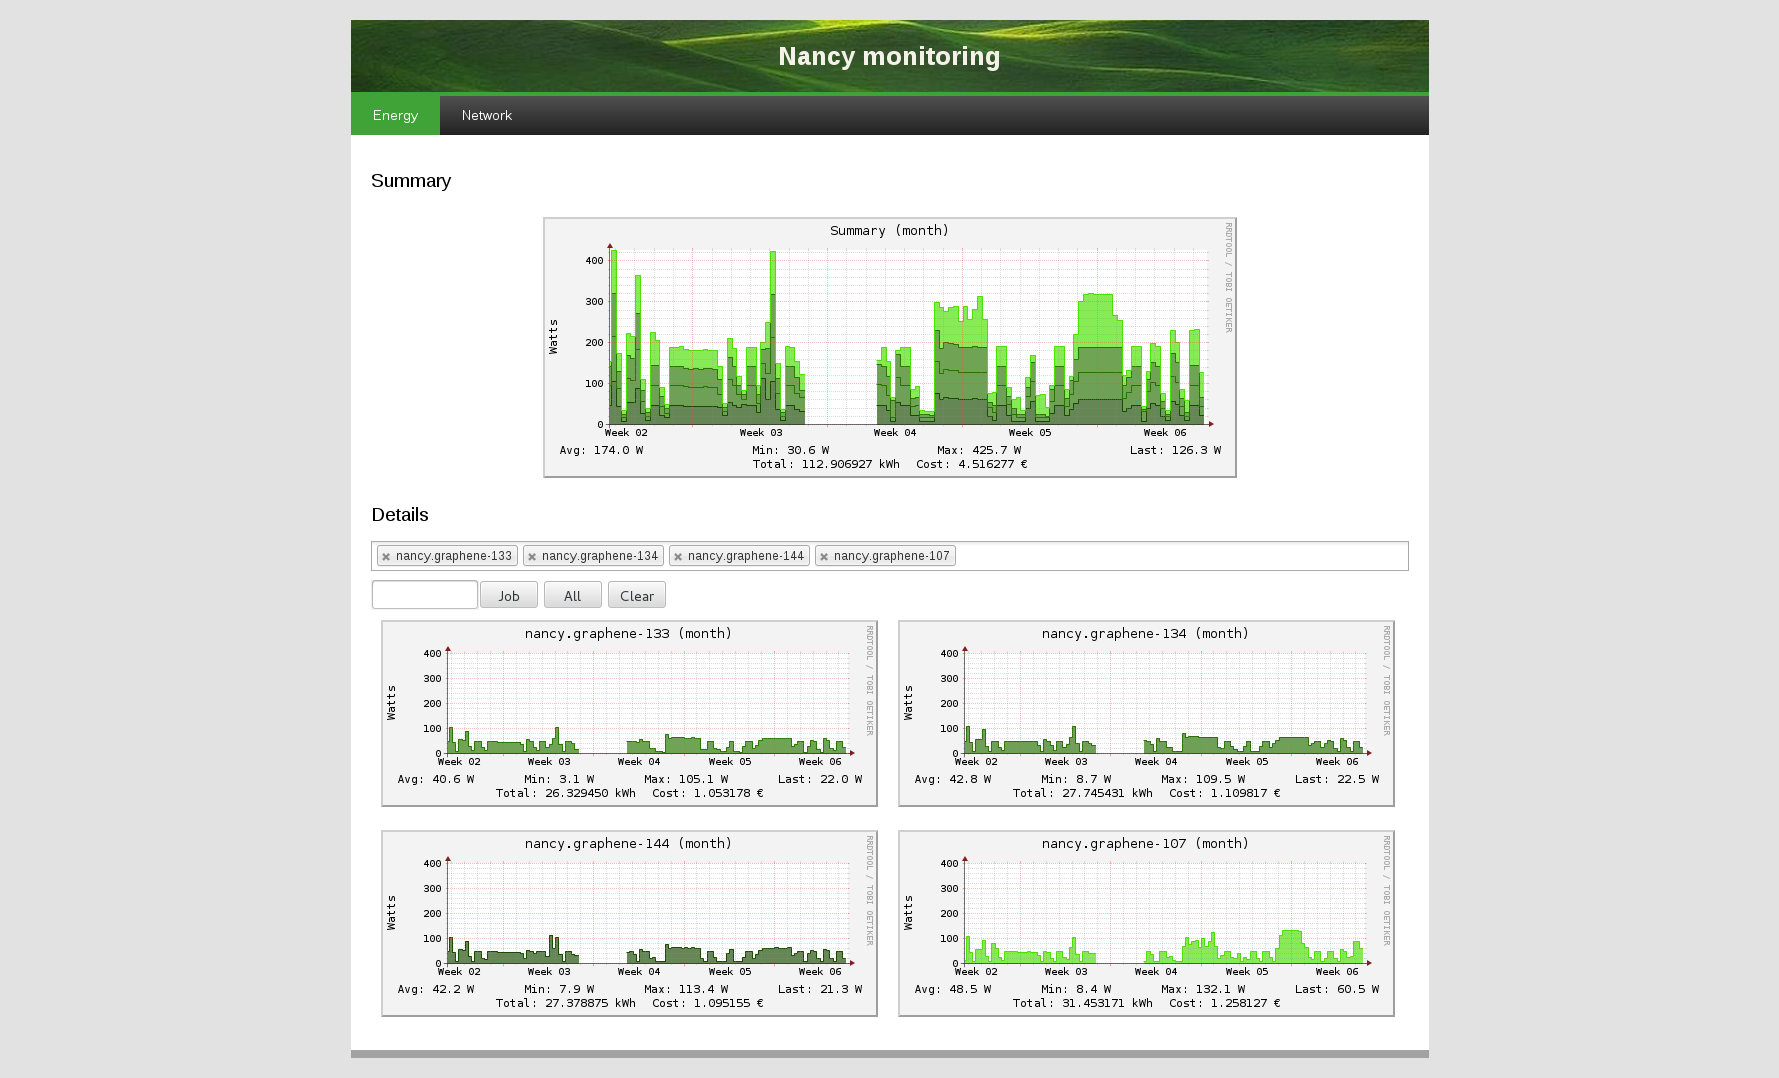
Kwapi Live plugin
Web interface
The visualization plugin provides a web interface with power consumption and network traffic graphs. It is based on Flask and RRDtool.
| Verb | URL | Parameters | Expected result |
|---|---|---|---|
| GET | /<metric>/last/<period>/ | metric { power, network } period { minute, hour, day, week, month, year } | Returns a webpage with a summary graph and all probe graphs. |
| GET | /<metric>/probe/<probe>/ | metric { power, network } probe id | Returns a webpage with all graphs about this probe (all periods). |
| GET | /<metric>/summary-graph/<start>/<end> | metric { power, network } start timestamp end timestamp | Return a summary graph of the metric evolution about this period |
| GET | /<metric>/graph/<probe>/<start>/<end> | metric { power, network } probe id start timestamp end timestamp | Returns a graph about this probe. |
Webpage with a summary graph and all probe graphs:
Webpage with scales summaries of a probe:
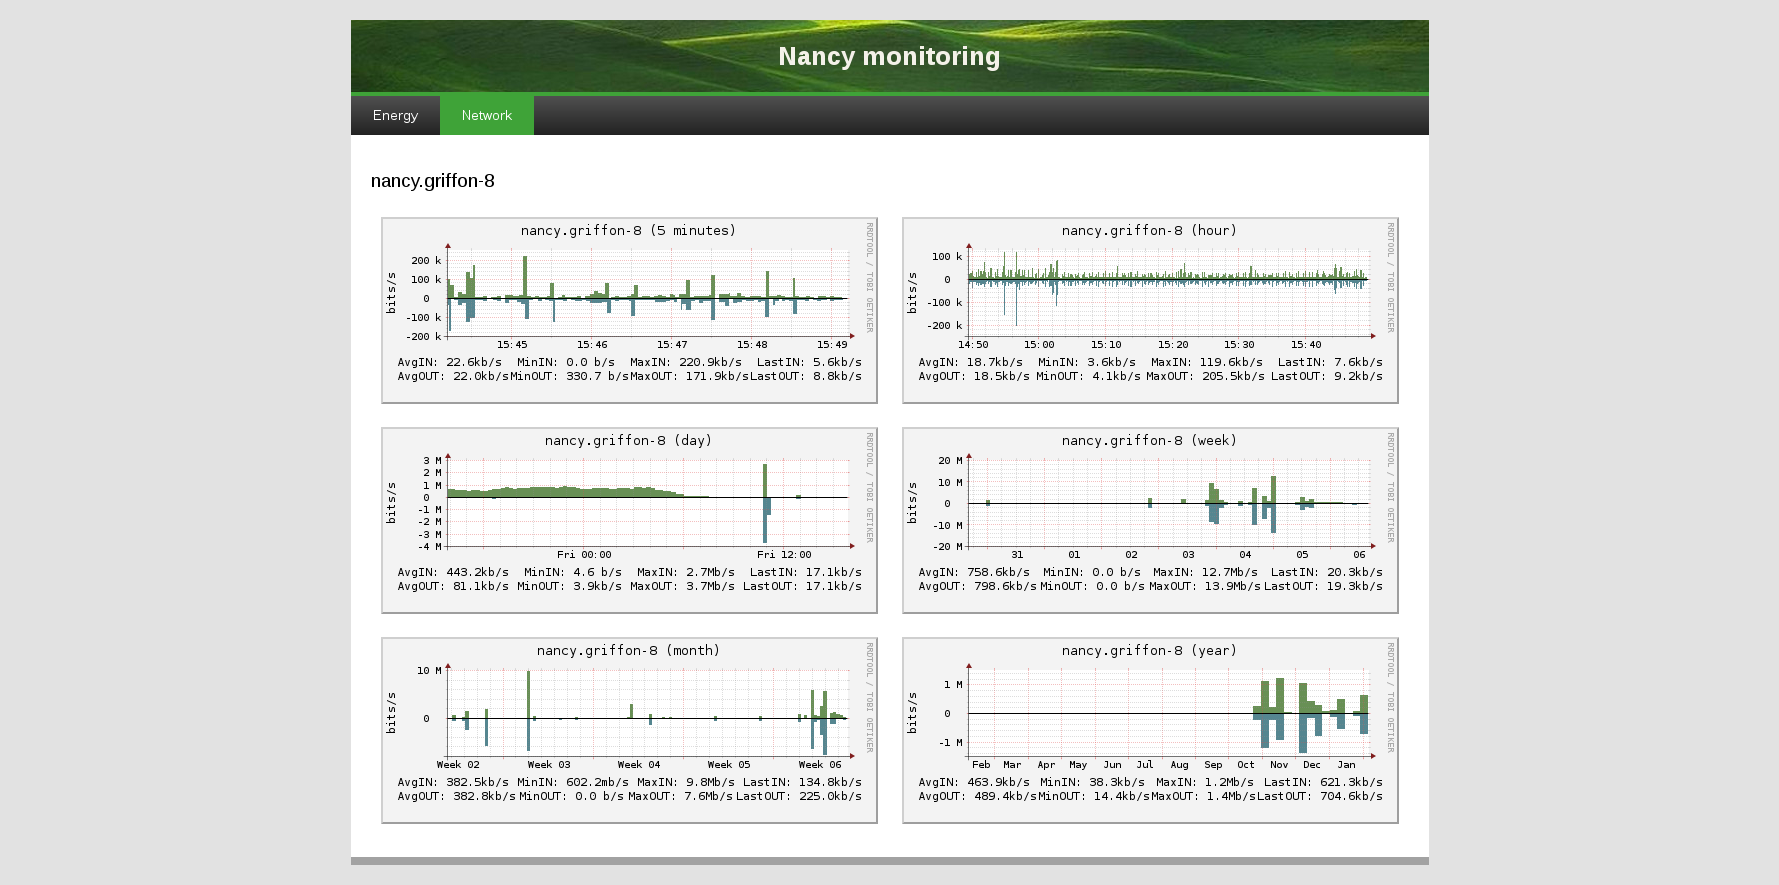
In the menu bar, you can choose the period the metric you want to display. For each metric you can select a timescale (last minutes, hour, day, week, month or year). By clicking on a probe, you can display all graphs available for this probe, with different resolutions.
You can select several probes and display a stacked summary of their consumption. Use the job field to automatically monitor probes corresponding to your job (select the correct probes and adapt timescale)
Graphs
The summary graph shows the total measurements for the selected metric (sum of all the probes). Each colour corresponds to a probe.
- The legend contains:
- Minimum, maximum, average and last measures.
- Integrated measure (energy consumed (kWh) or network traffic (Kb/s)).
- Cost if any.
- File sizes:
- RRD file: 10 Ko.
- Probe graph: 12 Ko.
- Summary graph: 24 Ko.
A cache mechanism prevents graphs from being rebuilt uselessly.
Kwapi forwarder
The forwarder aims at decreasing the network traffic: if multiple plugins listen the same probe, the metric is sent once on the network, and the forwarder duplicate it and sends a copy to each listeners. The forwarder can also be installed on a gateway machine, in order to connect isolated networks.
The following diagram shows these two features:
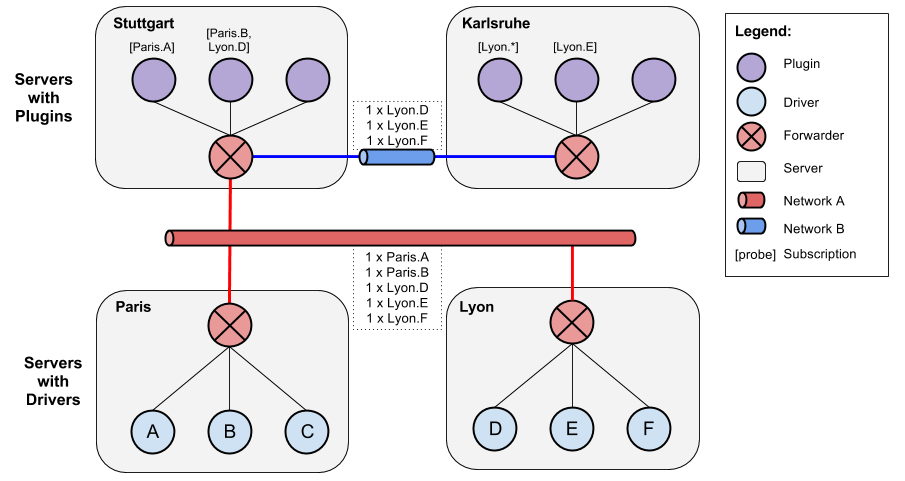
Using the forwarder is optional, and the plugins can be configured to subscribe directly to the drivers. Direct subscribing without using the forwarder is recommanded if the drivers and the plugins are running on the same machine.
Kwapi HDF5
Kwapi HDF5 is used to store fine grained metric with Kwapi. Each measure returned by the drivers are stored in an HDF5 file on the server. The main advantages of this database are: * Very large datasets: store several months of power consumption of numerous probes * Fast access * Hierarchical store: data can be groupped by site or cluster * Parallel writing * Compressed file for low storage cost * Heterogeneous data support
You can configure the split period of your HDF5 files in the configuration file (1 file per month or less) depending on how much data you want to save.
Collector
- The HDF5 Collector is composed of one Writter by metric with their proper buffers and a single queue per metric where all the data from drivers are appended.
- The update function put the new received value in the queue that correspond to his metric.
- Each Collector iterate on his corresponding queue and for each new measure, writes an entry in his internal buffer
- When a Collector buffer is full, it writes his values to the database on the disk depending on the current date
- If the plugin is stopped, a STOP flag his added in all the queues
- When the Collector receive a STOP flag, buffers are flushed on the disk and Collector exits
Writes on the database are made with a fixed chunk_size that can be set in the configuration file.
API
REST API permits to retrieve measures from those databases. Unlike RRD database, HDFStore store raw measures and datas are not alterated. API is very similar to Kwapi-API
| Verb | URL | Parameters | Expected result |
|---|---|---|---|
| GET | /<metric>/ | metric { power, network } | Returns all known probe IDs for the metric. |
| POST | /<metric>/timeseries/[job-id|probes] | metric { power, network } job_id in Grid‘5000 probes: list of probes | Return all data for the selected probes and selected range. Selection is made with job_id or probe name given. |
Kwapi Ganglia
This plugin his pretty simple. You first have to run a Ganglia server somewhere. It have to accept data from the remote Kwapi server. For this, edit the configuration file according to Ganglia Documentation. Check for the Ganglia multicast address.
The single parameter of this plugin is the ganglia_server address. Edit this field in the configuration file to point your remote Ganglia server. All data received from your drivers will be sended to the server. Actual configuration just send single power probes consumption to Ganglia.
| Metric | Remote name | Parameters |
|---|---|---|
| power | pdu2 |
|
| network_in | None | |
| network_out | None |